Activity 11.7.4.
(a)
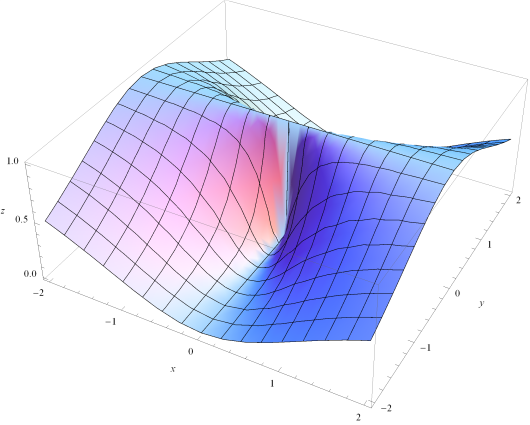
Figure 11.7.16 shows a graph of \(z=f(x,y)\) that you should use for the following:
-
On the \(xy\)-plane of the figure below, draw the direction vector \(\langle 1,1\rangle \) starting at the point \((2,-1)\text{.}\)
-
Draw a piece of the tangent line to the graph of \(f\) at the point \((2,-1,f(2,-1))\) which is in the direction \(\langle 1,1\rangle \text{.}\) The slope of the tangent line in the \(\langle 1,1\rangle \) direction is called the directional derivative of \(f\) at \((2,-1)\) in the \(\langle 1,1\rangle \) direction and is denoted \(D_{\langle 1,1\rangle} f (2,-1)\text{.}\)
-
Is \(D_{\langle 1,1\rangle} f (2,-1)\) positive, negative, or zero? Justify your answer.
-
On the \(xy\)-plane of (a new plot of) the figure below, draw the direction vector \(\langle -\frac{1}{2},3\rangle \) starting at the point \((2,-1)\text{.}\)
-
Draw a piece of the tangent line to the graph of \(f\) at the point \((2,-1,f(2,-1))\) which is in the direction \(\langle -\frac{1}{2},3 \rangle \text{.}\) The slope of the tangent line in the \(\langle -\frac{1}{2},3 \rangle \) direction is called the directional derivative of \(f\) at \((2,-1)\) in the \(\langle -\frac{1}{2},3 \rangle \) direction and is denoted \(D_{\langle -\frac{1}{2},3 \rangle} f (2,-1)\text{.}\)
-
Is \(D_{\langle -\frac{1}{2},3 \rangle} f (2,-1)\) positive, negative, or zero? Justify your answer.
(b)
Let \(f\) be the function whose graph appears in Figure 11.7.16. For each value of \(t\) the vector \(\langle \cos(t),\sin(t)\rangle \) is a direction vector. The value of \(D(t)=D_{\langle \cos(t),\sin(t)\rangle} f (1,-1)\) a scalar.
-
What direction is the vector \(\langle \cos(t),\sin(t)\rangle \) in for
-
\(\displaystyle t=0\)
-
\(\displaystyle t=\frac{\pi}{2}\)
-
\(\displaystyle t=\frac{3\pi}{2}\)
-
\(\displaystyle t=\pi\)
-
-
Is the value of \(D(t)=D_{\langle \cos(t),\sin(t)\rangle} f (1,-1)\) positive, negative, or zero for:
-
\(\displaystyle t=0\)
-
\(\displaystyle t=\frac{\pi}{2}\)
-
\(\displaystyle t=\frac{3\pi}{2}\)
-
\(\displaystyle t=\pi\)
-
-
Draw the graph of \(y=D(t)\) for values of \(t\) in the interval \([0,2\pi]\text{.}\) You should think about how the value of \(D(t)\) changes between the values you considered above to help you draw the graph of \(D(t)\text{.}\) Your graph doesn’t have to have exact values but should correctly identify where \(D(t)\) is positive, negative, and zero.
-
Draw the graph of \(y=G(t)=D_{\langle 1,1 \rangle} f (t,-t)\) for values of \(t\) in the interval \((0,2]\text{.}\) You should probably go through the same process you did above of looking at what \(G(t)\) will be for a few values of \(t\) between 0 and 2, then think about how \(G(t)\) will vary for values in between. The function \(G(t)\) is different than \(D(t)\text{.}\)
(c)
The graph of \(z=f(x,y)\) is as given below. In this problem, use geometric arguments to justify your answers.
-
Draw the line segment that goes from \((1,-1,f(1,-1))\) to \((2,0,f(2,0))\text{.}\) How does the slope of this line segment in that direction compare (smaller, equal, larger) with the value of \(D_{\langle 1,1 \rangle} f (1,-1)\text{?}\)
-
How does \(D_{\langle 1,1 \rangle} f (1,-1)\) compare with \(D_{\langle 0.01,0.01 \rangle} f (1,-1)\text{?}\) Justify your answer.
-
Which is closer to \(D_{\langle 1,1 \rangle} f (1,-1)\text{,}\) the slope of the line segment that goes from \((1,-1,f(1,-1))\) to \((2,0,f(0,2))\) or the slope of the line segment that goes from \((1,-1,f(1,-1))\) to \((1.01,-0.99,f(1.01,-0.99))\text{?}\) Explain your answer.
